Imagine you’re reading a magazine, and there’s this amazing design or layout that catches your eye. You’d love to take a closer look at how they made it, maybe even try something similar yourself. Now, imagine if you had a magic magnifying glass that let you peel back the layers of that magazine, revealing exactly how everything was arranged, from fonts and colors to even the little details like the spacing between lines. Well, when it comes to websites, Inspect Element is that magic magnifying glass!
This tool is built right into your browser (in Chrome, Firefox, Safari, etc.) and lets you dive behind the scenes of any website. You can click on an element and immediately see its HTML structure, CSS styles, and even how it interacts with JavaScript. You don’t need any special skills or tools, just your browser and a curious mindset.
Accessing Inspect Element Across Browsers
Table of Contents
ToggleOpening Inspect Element is super easy, no matter what browser you’re using. Here’s how you can do it in popular browsers like Chrome, Firefox, and Safari:
- Right-Click Method: The fastest way to open Inspect Element on any browser is to right-click on any part of the page you’re curious about and select “Inspect” or “Inspect Element” from the menu. This instantly brings up the developer tools, with the specific element you clicked on highlighted in the code.
- Shortcut Keys: If you like shortcuts, here’s how you can open Inspect Element with a quick key combo:
- Windows/Linux: Press Ctrl + Shift + C
- Mac: Press Cmd + Shift + C
After the command, click on the element to inspect. This shortcut opens the Inspect Element tool with the element selector enabled. You can then hover over different parts of the page to see the corresponding code highlighted in real-time, making it easy to pinpoint exactly what you want to examine.
- Specific Browser Steps:
- Chrome and Firefox: The right-click and shortcut methods work in both of these browsers and will get you to Inspect Element quickly. You’ll also find “Inspect” under More Tools > Developer Tools in the main settings menu.
- Safari: For Safari, you need to first enable the Develop menu by going to Safari > Preferences > Advanced and checking the box for Show Develop menu in menu bar. Once it’s enabled, you can right-click on a page element and select “Inspect Element”, or use the shortcut Cmd + Option + C.
Also read: The Hidden Honeypot Trap: How to Spot and Avoid It While Scraping
Getting to Know the Inspect Element Window
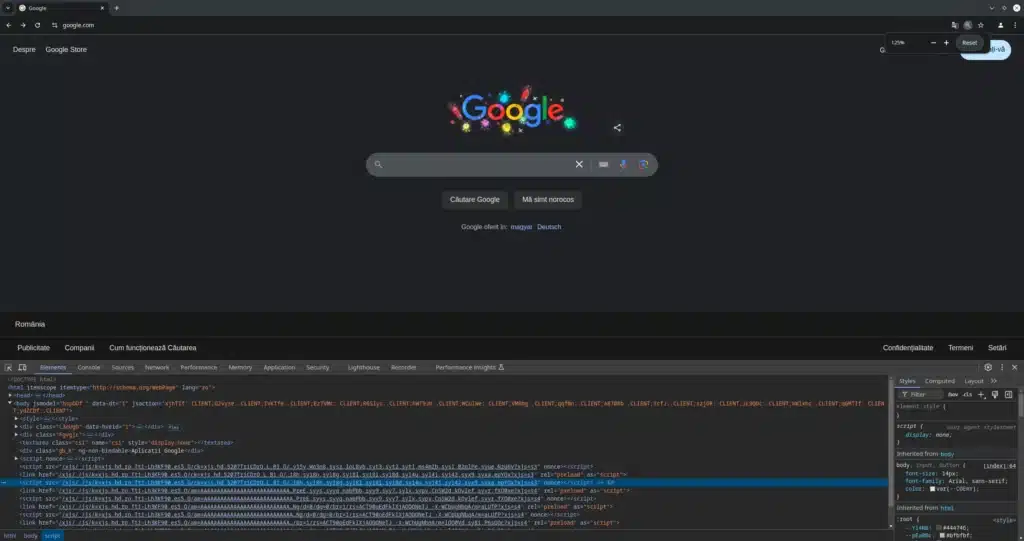
When you first open Inspect Element, you’re greeted by a set of panels that may look overwhelming at first glance. Think of each panel as a specific tool in a toolkit, each designed to help you understand and interact with different parts of the website.
With the Inspect Element feature, you get to see the website’s inner workings. Although you can only see frontend markup such as HTML, CSS, and sometimes JavaScript, it gives you a way to see precisely how the developers built a website.
Source: Kinsta. (2024). How to Use Your Browser’s Inspect Element Tool to Edit Webpages. Kinsta.
Here’s a quick rundown of the most useful panels and what they do:
DOM (Elements Panel)
This is the HTML section, showing you the entire page’s structure, often called the DOM, or Document Object Model. Imagine the DOM as the skeleton of the website, where every visible element from headers to buttons is mapped out in a tree-like structure.
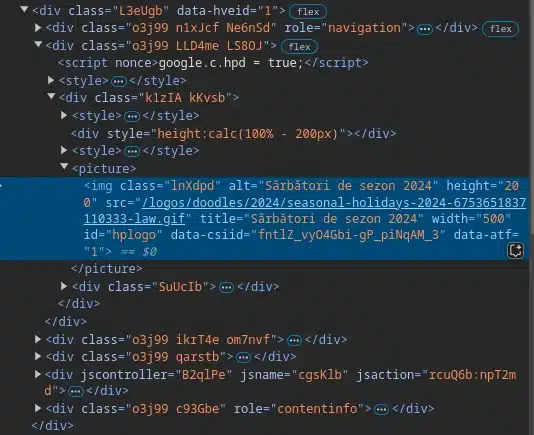
Here, you can click on elements to see their HTML code and inspect how everything is nested. If you want to make quick HTML tweaks or figure out how a certain part of the page is built, this is the place to start.
CSS (Styles Panel)
Right next to the DOM is the CSS panel, where you can see and play with the styles applied to each element. This panel is like the wardrobe for the skeleton, defining colors, fonts, spacing, and all the other styles that make a website look the way it does.
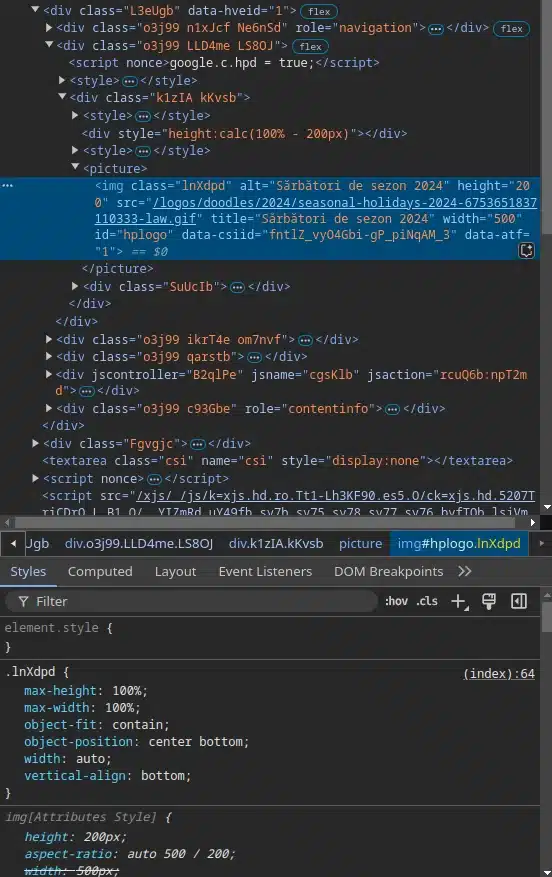
When you select an element, the Styles panel shows all CSS rules for that item, and you can add, remove, or toggle individual styles to experiment with different looks.
Console
The Console panel is a bit like the site’s logbook and test ground for JavaScript. It shows any errors, warnings, or messages that the site’s scripts have generated, making it invaluable for troubleshooting bugs.
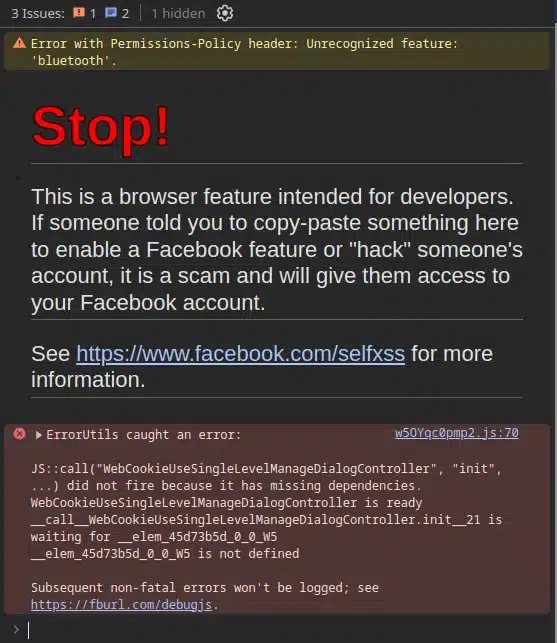
But you can also use it to test JavaScript snippets on the fly. Imagine being able to run little experiments with a website’s code without touching the actual files. That’s what the Console lets you do.
Network Tab
The Network tab is your go-to for performance analysis. It shows every resource that’s loaded when a page opens: images, scripts, stylesheets, and more, along with their loading times. It’s also used to see responses from APIs or URLs.
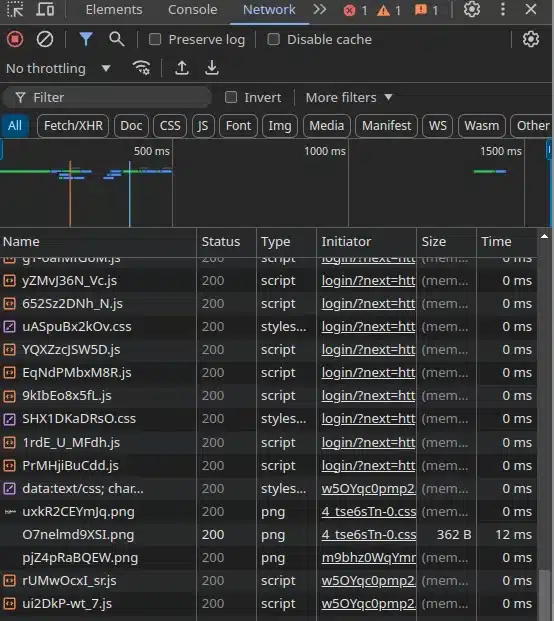
If you’re analyzing site speed or want to see how fast specific resources load, this is your window. It’s like a stopwatch for each component, helping you spot any speed bumps.
Other Panels (Event Listeners, DOM Breakpoints)
For more advanced testing, panels like Event Listeners and DOM Breakpoints are there to help. Event Listeners shows you any JavaScript events attached to a selected element, like button clicks or form submissions.
Meanwhile, DOM Breakpoints allow you to pause JavaScript execution when a certain element changes, which is especially helpful for debugging dynamic content.
Also read: Five Tips for Outsmarting Anti-Scraping Techniques
Inspect Element vs View Source vs Network Response (Rendered DOM vs Raw HTML)
If you’re doing scraper-style analysis, this is the difference that saves hours: Elements shows the rendered DOM, while View Source shows the original HTML, and Network shows what was actually fetched (HTML, JSON, XHR responses, etc.). The three views can disagree, and that disagreement is the clue.
| Tool | What you’re actually seeing | Best for |
|---|---|---|
| View Page Source | The initial HTML the browser received | Checking what’s present without JS |
| Inspect Element (Elements panel) | The current, rendered DOM after the browser + JS have done their thing | Finding selectors, layout, CSS, “what’s on screen now” |
| DevTools Network (Response tab) | The actual responses (HTML/JSON) returned by endpoints | Finding APIs behind infinite scroll, filters, pagination |
If your Python requests + BeautifulSoup scrape can’t find elements that you clearly see in Inspect Element, you’ve just hit the wall that affects 98.9% of websites. Client-side JavaScript. You’re scraping raw HTML, an empty skeleton with placeholders and script tags, while Inspect Element shows you the fully rendered DOM that only exists after JavaScript execution.
Some sites also use decoy nodes and/or hidden links that appear in one view but not the other. When View Source and Elements disagree in suspicious ways, treat it like a trap signal and cross-check Network responses before building a parser.
Customizing Your Layout
Inspect Element doesn’t have to feel cramped or cluttered. You can easily set it up to fit your workflow and make it feel more comfortable. Here are a few quick ways to adjust it to your needs:
- Docking Options: You can control where the Inspect Element panel appears on your screen. Dock it to the side or bottom of your browser, or even pop it out into a separate floating window. Think of it like moving your workspace around to get a better view. Side-docking is great if you need to see the entire page while inspecting it, while bottom-docking is nice for a more focused look at code.
- Rearranging Panels: You can drag and rearrange panels within Inspect Element, putting the ones you use most like Elements or Console front and center. This saves you from constant clicking around and makes sure your favorite tools are always visible. It’s like organizing your desk so the essentials are right at hand.
- Dark Mode and Experimental Features: If you prefer a darker workspace, try switching to dark mode in the settings for a softer look that’s easier on the eyes. Plus, you can turn on experimental features to test out new tools before they’re officially released. Try out a sneak preview of the latest gadgets, some will make their way into the main toolset, and some might disappear, but they’re always fun to explore.
Also read: Microsoft’s Deception Bytes: Outsmarting Scammers with Virtual Honeypots
Analyzing the DOM to Understand Page Structure
Inspecting the DOM (Document Object Model) is like taking a peek behind the curtain to see how a webpage is built. This view lets you understand the layout by showing you the structure and relationships between elements. Here’s how to read the DOM like a pro:
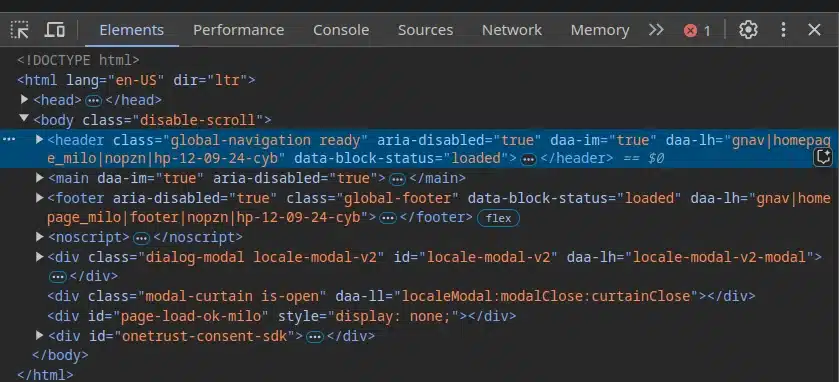
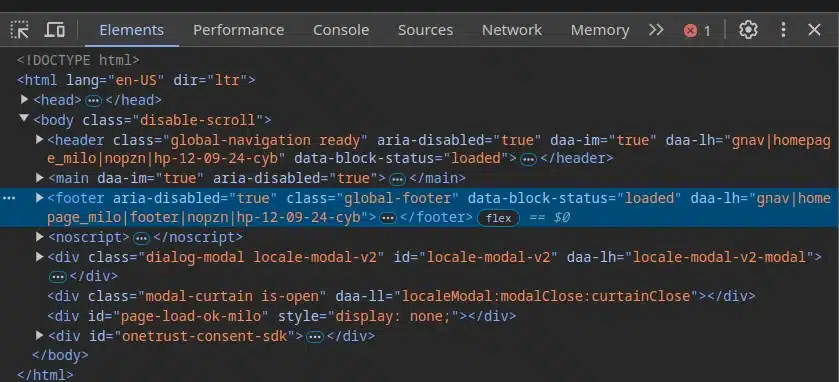
- Identify Main Sections: Start by looking for key sections in the DOM tree, like header, main, footer, and body. These elements act as the big containers that organize different parts of the page, so knowing where they are will give you an instant sense of the layout. For instance, header usually holds the navigation, main includes the central content, and footer wraps up the bottom info.
- Expand Key Elements: Click on elements like body or main to expand them and see the parent-child relationships. It’s like opening up a file folder. You’ll see all the nested items inside, which shows how different parts of the page relate to each other. By expanding these elements, you can also find sub-sections or grouped content, like sidebars or specific article sections.
- Check IDs and Classes: As you go through the DOM, look at each element’s IDs and classes. IDs are unique to one element on the page, and they’re a great way to spot significant parts, like the header or main content. Classes, on the other hand, are often used to style groups of elements like product items or sidebars and they’ll give you clues about repeated sections or styling choices.
Also read: How to Prepare Effective LLM Training Data
Key HTML Tags to Focus On
When you’re diving into the DOM, some HTML tags can give you quick clues about how a webpage is structured and where to find the content you’re after. Here’s a rundown of the tags that will help you find your way around:
- Structural Tags: These tags outline the main layout of the page:
- html: This is the root of the page, holding everything you see on the DOM tree.
- head: Think of it as the behind-the-scenes area, holding metadata like titles, scripts, and links to stylesheets.
- body: This is where all the visible content lives. Everything you see on the page is tucked inside the body.
- footer: Located at the bottom of the page, the footer often has links, contact info, or copyright details.
- Semantic Tags: These tags make it easy to see how the page is organized. They add meaning to the content:
- header: Holds navigation links, the logo, or site name, essentially the intro to the page.
- main: The main section of content, where the meat of the page lives, whether that’s articles, product details, or blog posts.
- section: Groups related content together; you might see multiple section tags dividing the page into logical parts.
- article: Used for self-contained content, like a blog post or news story that could stand alone.
- Interactive Tags: These tags make the page more interactive and clickable:
- button: A clickable button that triggers actions like submitting a form or navigating to another page.
- a (anchor): Creates hyperlinks, so look for these to find clickable links on the page.
- input: Used in forms to collect user data, anything from text fields to checkboxes will be within an input.
Also read: Well Paid Web Scraping Projects
Experimenting with CSS and HTML in Real-Time
Inspect Element is perfect for testing style changes or adjusting content on the fly. Think of it as a sandbox where you can see changes instantly without touching the actual site code. Here’s how to get the most out of it:
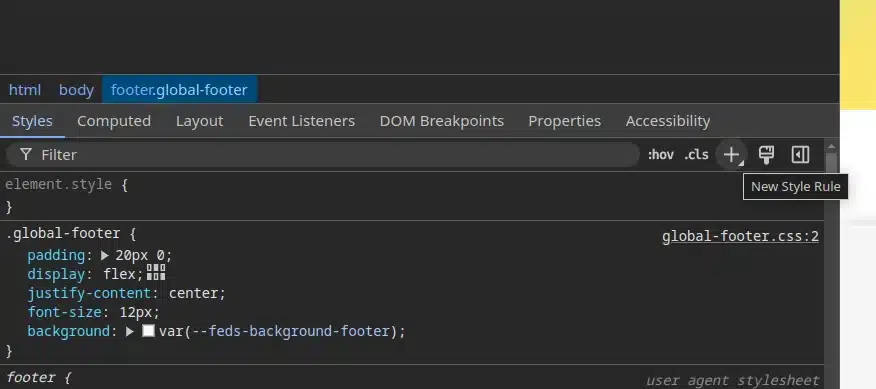
- Add New CSS Rules and Toggle Styles On/Off: In the CSS (Styles) panel, you can experiment by adding new rules or tweaking existing ones. Click the little “+” button to add a new rule and see how it affects the page. You can also toggle specific styles on or off by clicking the checkbox next to each rule. This helps you see what removing or changing each style does, making it easy to troubleshoot layout issues.
- Experiment in Device Modes: Try out your changes across different screen sizes with the responsive mode in Inspect Element. This lets you see exactly how your CSS tweaks look on a mobile screen, tablet, or desktop. Just click on the device icon in the Inspect Element toolbar to switch to different viewports. It’s a quick way to make sure your changes look great everywhere.
- Use the Console for Real-Time JavaScript Styling: If you need to apply styles via JavaScript like changing styles based on user actions, the Console is your go-to. You can add JavaScript snippets directly in the Console to update styles in real-time. For example, if you want to hide an element temporarily, type:
document.querySelector(‘.example-class’).style.display = ‘none’;
This makes it super easy to test JavaScript-driven changes before actually implementing them.
Also read: How to Avoid Network Honeypots?
Saving and Exporting Your Changes
Once you’ve made tweaks in Inspect Element that you want to keep, it’s easy to save or export them so you can apply them later. Here are the quickest methods to make sure your hard work isn’t lost:
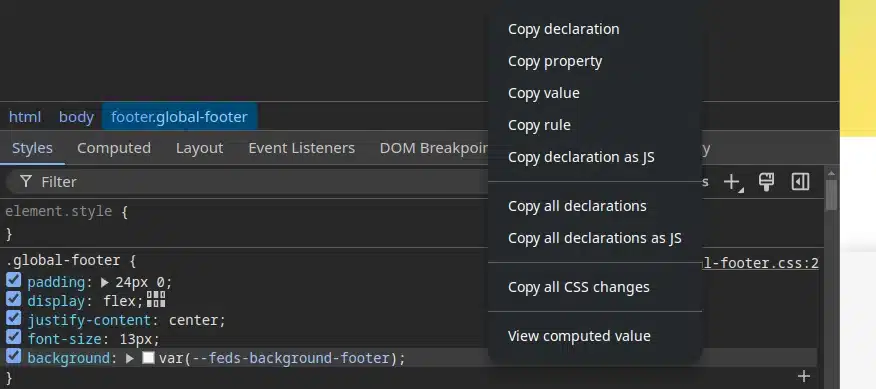
- Copy/Paste Updated CSS or HTML: If you made style adjustments in the CSS panel, just right-click and select “Copy” on any edited CSS rule. Then paste it into your own CSS file. For HTML changes, right-click on the updated element in the DOM (Elements panel) and choose “Edit as HTML” to copy the modified code. It’s straightforward, but effective!
- Use the “Changes” Tab to Track Edits (only on Firefox Dev Edition): Want a quick record of everything you changed in one place? Head to the “Changes” tab under “More Tools” in Inspect Element. This tab logs every tweak you’ve made, showing side-by-side comparisons of the original and modified code. From here, you can copy all your adjustments and transfer them to your project files without missing a detail.
Also read: How Often Do Crawlers Need to Rotate IPs and Why
Limitations in the Console
Testing JavaScript in the Console can be super useful, but it comes with a few quirks that are good to keep in mind:
- Changes Disappear on Page Refresh: One of the most frustrating things is that any tweaks you make to JavaScript directly in the Console are temporary. As soon as you refresh the page, poof, your changes are gone. If you’re experimenting with code that you want to keep, copy it somewhere else like a code editor before refreshing.
- Global Scope Only: The Console operates in the global scope, meaning it only recognizes variables and functions that are globally accessible. If you’re trying to interact with specific parts of the code that are local like, for example, nested inside functions or blocks, the Console might not find them. You may need to temporarily adjust your code to make certain variables accessible or work within the limitations of the global scope.
- Asynchronous Timing Challenges: JavaScript often relies on asynchronous events like fetching data and testing these in the Console requires careful timing. Events might not fire in the order you expect, so if you’re testing asynchronous code, use functions like setTimeout or async/await to control the timing, or add logs to check when things are running.
Also read: Sending Email Notifications in Python
Extracting Data from the Webpage
Pulling data from a webpage can be surprisingly straightforward. Whether you’re trying to gather info for analysis or just learning how the page is structured, here are a couple of ways to go about it:
- Manual Data Collection with Unique Selectors: First, find the elements you need by using unique selectors like id or class. Inspect Element can help you narrow in on these elements quickly. Once you locate them, just copy what you need directly from the DOM. For example, if you’re looking at a list of product names, find the <div> or <span> with the relevant class, and you’ll be able to see and copy the data inside.
- Using JavaScript for Quick Data Logging: For a faster approach, use JavaScript to pull data in bulk. A simple Console command can log out text or attributes from multiple elements. For instance, if you want to grab a bunch of product names all at once, try a code snippet like this: document.querySelectorAll(‘.product-name’).forEach(el => console.log(el.textContent)). This will print each item in the Console, making it easy to copy.
- Respect robots.txt: Before automating data extraction, check the site’s /robots.txt for crawl directives. The Robots Exclusion Protocol is a voluntary standard for well-behaved crawlers, and it is not a form of access authorization or legal permission. Treat it as a strong signal of the site owner’s preferences, then also review the site’s Terms and applicable laws before scraping.
Also read: Data Parsing with Proxies
Using the Network Tab for API Requests and Speed Analysis
The Network tab in Inspect Element is like a backstage pass to all the data and resources a webpage loads. It’s a powerful tool for spotting slowdowns and analyzing API requests, especially if you’re aiming to optimize speed or understand how data loads. Here’s how to use it effectively:
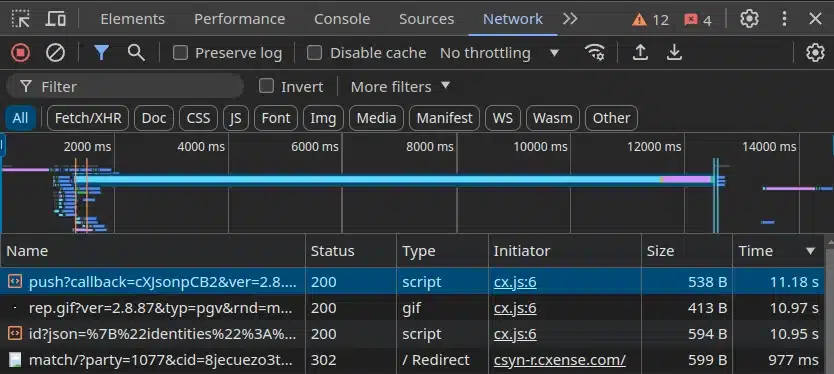
- Identify Slow-Loading Resources: When you open the Network tab and refresh the page, you’ll see a list of every resource the page loads, from images to JavaScript files. Pay attention to the “Time” column. It shows you how long each item takes to load. If you see something with a long load time, like a large image or a script, that could be an opportunity to optimize like resize, compress, or even lazy-load, to improve overall page performance.
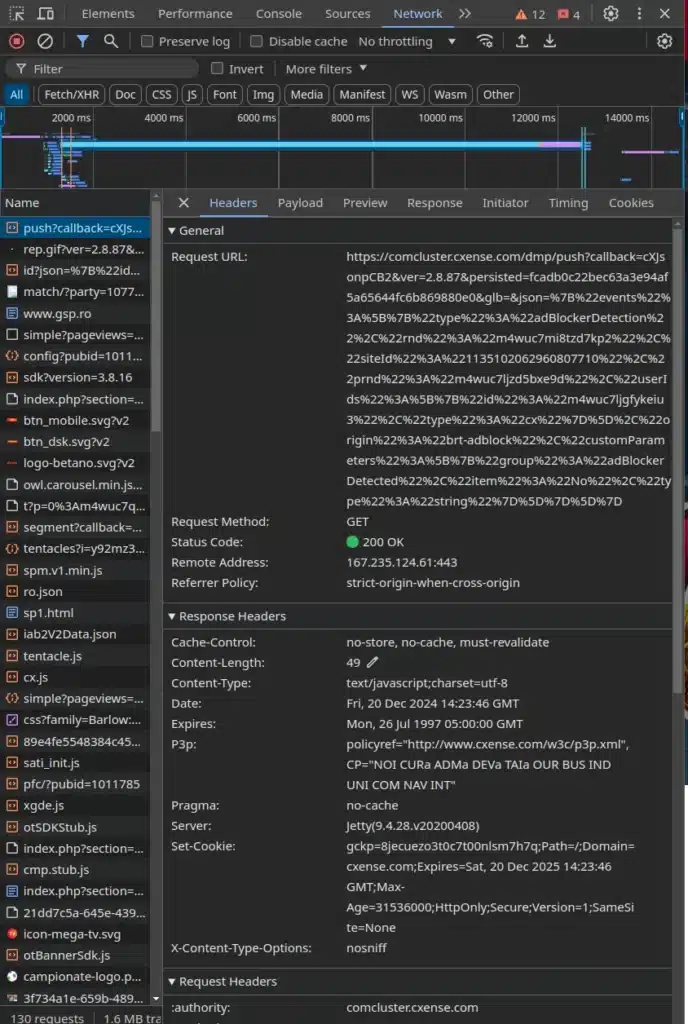
- Monitor API Requests in Real-Time: The Network tab also shows live API calls. This is especially helpful if you’re curious about how data is fetched or sent on a page. You can click on any request to see details like headers, request payload, and response data. This lets you see exactly what’s going on behind the scenes like when a search suggestion pops up, it’s often a real-time API call you can observe here.
Also read: Anti-Scraping Technology (Video Summary Included)
Tracking Dynamic Content
Dynamic content, like live updates, pop-ups, or auto-refreshing elements, can make a page feel interactive and real-time but can also be tricky to analyze. Here’s how to keep up with these changes using Inspect Element and some additional tools.
- Watch for Changes in the Network and Console Tabs: When content loads dynamically, it often triggers new API requests or script logs. Open the Network tab and refresh the page; as data loads, you’ll see real-time requests for things like new posts or search suggestions. The Console tab can also help track dynamic updates by logging changes, errors, or scripts in action. Watching these tabs lets you pinpoint exactly when and how content is updated.
- Automated Tracking with Headless Browsers: For ongoing tracking of dynamic pages, headless browsers or Puppeteer, a JS library used to control browsers or other dev tools, are great options. They run scripts to interact with a page automatically. Think of them as robots that can simulate clicks, scrolls, or data entry while capturing screenshots or monitoring changes. This is especially handy if you’re watching for changes on a competitor’s site or testing how a webpage updates without manually refreshing it every time.
Also read: The Future of Ad Verification: AI’s Impact on Brand Safety
Using the Console for JavaScript Interaction
The Console tab is your playground for testing JavaScript directly on a webpage. It’s your backstage pass to see how things work and experiment in real-time.
- Paste, Test, and Log: Want to test out a bit of code or see the value of a variable? Just type it into the Console and hit Enter. You can paste snippets to test functions, change values, or run custom scripts. Need to see if a certain element is working? Use console.log() to print out values or function results right there in the Console. It’s a simple way to confirm things are behaving as you expect.
- Manually Trigger Events: Sometimes, you want to see how an element reacts to user actions like clicks or hovers. In the Console, you can manually trigger these events to watch how they behave. Select an element and simulate a click with code like element.click(). This can be handy for testing buttons, links, or even form submissions without actually doing it on the live page.
- Clear the Console for Fresh Testing: Console getting cluttered? Hit clear() or click the trash icon to wipe it clean. Starting with a fresh Console view helps you focus on the current testing, so you don’t mix up old logs with new ones.
Also read: Free Libraries to Build Your Own Web Scraper
Debugging Common Issues
When a webpage isn’t behaving as it should, the Inspect Element tool can be your first line of defense for finding and fixing issues. Here are some quick techniques to troubleshoot common problems with scripts or layout:
- Check for Errors in the Console: The Console tab acts like a running log of everything happening on a page. Errors and warnings show up here, and they often come with details about what went wrong. If a script isn’t working, look for red error messages in the Console to see where the issue might be. These messages often include line numbers and file names, giving you a roadmap to where things went off track.
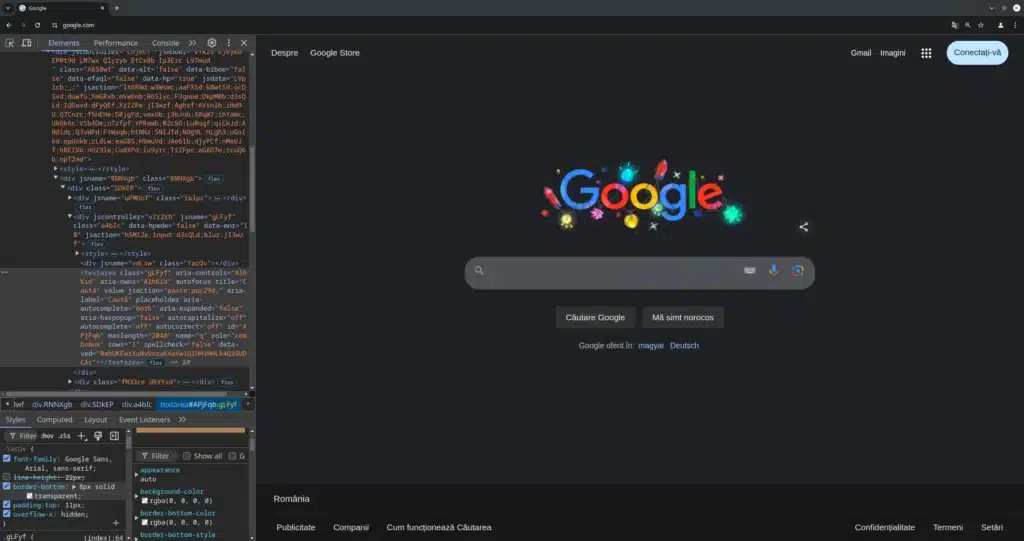
- Inspect CSS Specificity and Toggle Styles: If layout or styling looks strange, it could be a CSS specificity issue, where certain styles are overriding others unexpectedly. Use the Elements panel to see all styles applied to an element. You can toggle individual CSS properties on and off by clicking the checkboxes next to them. This helps you see which rules are affecting the layout and find any conflicts. It’s an easy way to test changes before updating the actual stylesheet.
- Use Breakpoints to Troubleshoot JavaScript: Breakpoints allow you to “pause” JavaScript execution at specific lines so you can see the state of the code step-by-step. Set a breakpoint by clicking the line number in the Sources tab. When the code hits that line, it pauses, letting you inspect variable values and understand what’s going on. Breakpoints are especially helpful for debugging functions that rely on user input or dynamic data, allowing you to see exactly where things go wrong.
Bonus Tools and Extensions
If you’re ready to take your Inspect Element skills to the next level, there are some awesome extensions and tools that complement it perfectly. These tools streamline specific tasks, from analyzing load speed to understanding CSS styles. Here are a few to check out:
React and Vue DevTools
If you’re working with a site built in React or Vue, these DevTools make it a breeze to inspect the component structure, see props and states, and troubleshoot issues specific to these frameworks.
React DevTools and Vue DevTools add dedicated tabs to the Developer Tools, giving you a full breakdown of each component and how they interact.
Lighthouse
Lighthouse is Google’s performance and SEO testing tool built into Chrome DevTools. It’s perfect for checking how well your site is optimized, with audits on performance, accessibility, and SEO.
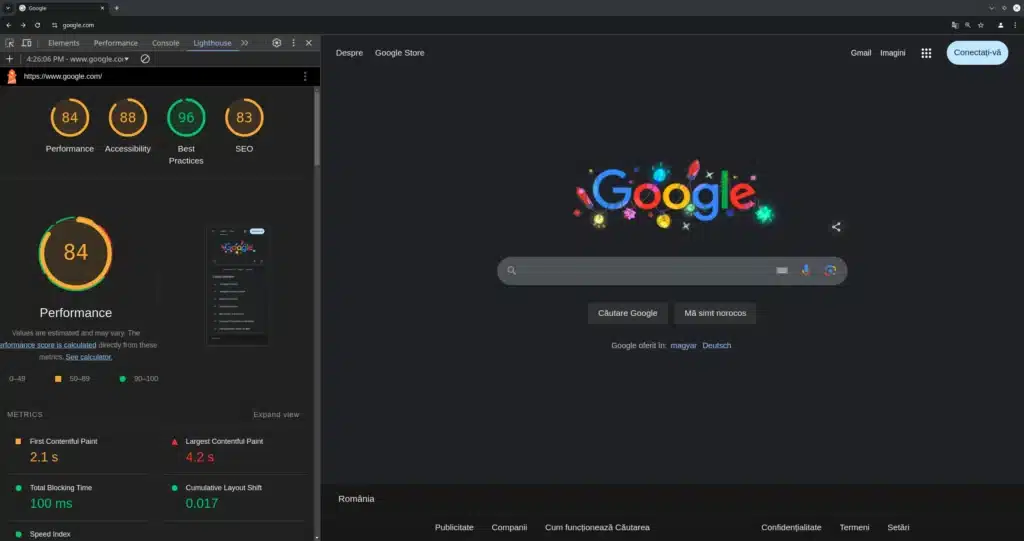
With a single click, you get a detailed report that’s loaded with tips for improvement, especially useful if you’re focusing on user experience or mobile performance.
PageSpeed Insights
PageSpeed Insights is another Google tool that provides an in-depth look at your website’s loading speed. It highlights specific areas slowing down the site, like large images or excessive scripts.
Proper image optimization can reduce page load times by 40-60% while maintaining visual quality that users expect.
Source: Addy Osmani, Web Performance Expert & Head of Google Chrome Developer Experience
It’s great for identifying bottlenecks that affect load times and page interactivity, which can be optimized based on the suggestions it provides.
WhatFont
Have you ever wanted to know exactly what font a website is using? WhatFont is a simple extension that reveals font details when you hover over text.
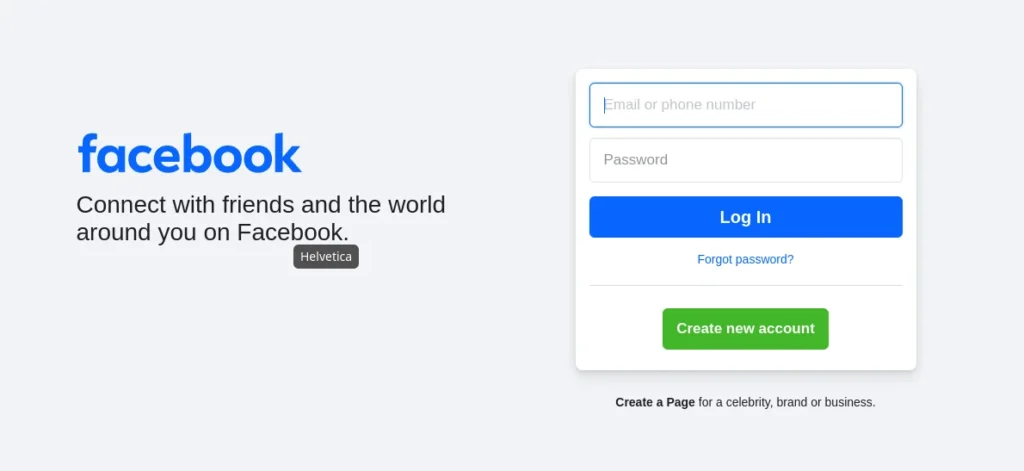
It tells you the font family, size, weight, and even color, so you don’t have to dig through CSS manually. It’s a quick way to learn what makes a site’s typography look sharp.
CSS Peeper
CSS Peeper is perfect for quickly grabbing a website’s styling details, like colors, fonts, and layout dimensions.
It simplifies CSS inspection by letting you click on elements to see their styles without diving deep into the CSS code. This is especially handy if you’re working on a design and need a quick reference for styling choices.
Also read: Five Reasons to Never Use Free Proxies for Web Scraping
Ethical Considerations in Inspect Element Use
Using Inspect Element gives you a lot of power, but with that power comes some responsibility. Here’s a quick checklist to help you keep your web-sleuthing on the ethical side:
- Avoid Copying Proprietary Code: While it might be tempting to copy bits of JavaScript or CSS, remember that website code is typically the intellectual property of its creators. It’s totally okay to look for learning and inspiration, but avoid directly lifting someone else’s code without permission. Instead, use what you find as guidance to create your own unique solutions.
- Respect User Privacy and Robots.txt: Web scraping or automating content extraction can be helpful, but be cautious. Many sites have a robots.txt file that sets rules for what can be accessed by bots. Make sure to check this file if you’re considering any automated scraping. Also, keep user privacy in mind—don’t dig into user-specific data or try to bypass security measures.
- Don’t Copy Competitor Styles: Inspecting a competitor’s website can offer design ideas and insights into popular features, but copying their styles exactly is a no-go. Aim to understand what works for them and think about how you can adapt similar concepts in your own unique way. You’ll come up with a better result that’s both inspired and original.
Also read: Web Scraping With Proxies
Tracking Competitor Updates
If you want to stay up-to-date with competitors’ website changes without doing a full code dive every time, there are some helpful tools and methods to simplify the job. Here’s a quick guide on keeping an eye out for updates while staying respectful and ethical.
Use Crawling Tools
Tools like Screaming Frog can scan websites, giving you a detailed snapshot of the site’s structure and SEO setup.
You can use it periodically to spot any new pages, updated links, or changes in tags and metadata, which might indicate content updates or restructured navigation.
The Wayback Machine for Historical Snapshots
Wayback Machine is like a time machine for the web, capturing snapshots of sites over time.
You can check out archived versions of a competitor’s site and compare them to the current one to see any design, content, or structural shifts. It’s a great way to get context on major site updates without needing real-time monitoring.
GitHub for Open Source Projects
If the competitor has public repositories on GitHub, which is rare for most websites but common in some open-source projects, you can track changes directly.
GitHub will show when they push new code or modify existing files, letting you track updates without relying on web tools alone.
Manual Snapshots in Developer Tools
Taking manual snapshots in Inspect Element or other developer tools can also work for smaller sites.
Capture key sections or pages, and revisit them over time to see how things evolve. This is handy if you only need to keep tabs on specific parts of the site, like a pricing page or blog layout.
Also read: High-Scale Bot Automation: Succeed in Competitive Markets
Sample Code for Practicing Your Inspect Element Skills
Use JavaScript to modify or hide an element directly through the Console.
// Select an element by ID and change its inner HTMLdocument.getElementById('example-id').innerHTML = 'New Content';// Hide an elementdocument.querySelector('.example-class').style.display = 'none';Show how to pull data from specific elements by logging their text or attributes in the Console.
// Log text content from elements with a specific classdocument.querySelectorAll('.product-name').forEach(el => console.log(el.textContent));Illustrate how to time resource loading for analysis of site performance.
// Measure load time of imagesperformance.getEntriesByType('resource').forEach(resource => { if (resource.initiatorType === 'img') { console.log(`${resource.name} loaded in ${resource.responseEnd - resource.startTime}ms`); }});Use JavaScript to detect and, if necessary, temporarily disable event listeners on elements.
// List all event listeners for a specific elementgetEventListeners(document.getElementById('example-id'));// Disable a click eventdocument.getElementById('example-id').onclick = null;Show how to dynamically add content or attributes.
// Adding a custom class to a selected elementdocument.querySelector('.example').classList.add('new-class');Provide a simple code to extract data from HTML tables or lists for competitive analysis.
// Extract and log data from a tablelet tableData = Array.from(document.querySelectorAll('table tr')).map(row => Array.from(row.querySelectorAll('td')).map(cell => cell.textContent));console.log(tableData);Show how to access and log metadata (e.g., title, description) of the page.
console.log('Title:', document.title);console.log('Description:', document.querySelector("meta[name='description']").getAttribute('content'));Also read: Global Website Load Testing: Techniques for Optimizing Across Multiple Regions
Conclusion
Congrats! You’ve got a solid foundation on using Inspect Element to peek under the hood of any website, troubleshoot, experiment, and even monitor changes over time. With these tools and tricks, you’re ready to test new ideas, make adjustments on the fly, and understand site structures like a pro.
Remember, Inspect Element is your creative playground for trying out new CSS tweaks, testing JavaScript snippets, and refining your site-building skills. The more you explore, the more you’ll discover what’s possible and the faster you’ll be at identifying and solving issues.
Keep experimenting, keep learning, and don’t be afraid to get your hands dirty in the code. With every new project or problem, you’ll sharpen your eye for web development, and soon enough, Inspect Element will feel like second nature.
FAQs About Inspect Element
Q1. What is Inspect Element?
Inspect Element is a built-in browser tool that lets you view and edit a website’s HTML, CSS, and JavaScript code in real-time. It’s available in all major browsers like Chrome, Firefox, and Safari and helps you understand page structure, troubleshoot issues, and experiment with design changes without affecting the actual website.
Q2. How do I open Inspect Element?
Right-click anywhere on a webpage and select Inspect or Inspect Element. Alternatively, use keyboard shortcuts: Ctrl+Shift+C for Windows/Linux or Cmd+Shift+C for Mac. In Safari, first enable the Develop menu in Preferences > Advanced before accessing Inspect Element.
Q3. Can Inspect Element make permanent changes to a website?
No. Changes made in Inspect Element only affect your local view and disappear when you refresh the page. You’re editing a temporary copy in your browser, not the actual website files. To keep changes, you must copy the modified code to your own project files.
How useful was this post?
Click on a star to rate it!
Average rating 0 / 5. Vote count: 0
No votes so far! Be the first to rate this post.
Tell Us More!
Let us improve this post!
Tell us how we can improve this post?

